Kamis, 17 Januari 2013

Accelerated Arctic Warming

The more northern we look, the more Earth is warming, as shown by the NASA image below.

global temperature anomalies averaged from 2008 through 2012, NASA Goddard Institute for Space Studies
The interactive image below shows temperature anomalies for the different latitudional zones over time.

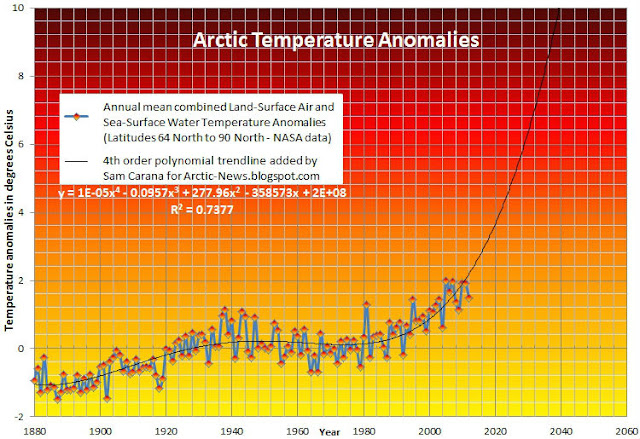
The Arctic (red line above) clearly shows the strongest warming over time, while accelerating in recent years. The best fit for this warming in the Arctic is a fourth order polynomial trendline, as added to the data on the image below.


This accelerated warming in the Arctic is threatening to destabilize the methane in the seabed and trigger runaway global warming within a decade. Effective action needs to be taken before it's too late!
Share on Facebook
Share on Twitter
Share on Google+

Related : Accelerated Arctic Warming

  • Climate Change AcceleratingMethane levels as high as 2562 ppb were recorded on October 9, 2014, as illustrated by the image below.Many grey areas show up in the image where QC (quality control) fa ...
  • CLIMATE REPORT'S HUGE OMISSION OBSCURES FULL DANGERby Gary HouserCLIMATE REPORT'S HUGE OMISSION OBSCURES FULL DANGER:Grassroots Must Insist IPCC Include Massive Permafrost Carbon "Across two decades and thousands of page ...
  • Arctic Ice Breaks Up in Beaufort SeaThe NOAA image below gives an update on the temperature anomaly over Greenland, as earlier discussed in the post including Huge patches of warm air over the Arctic. ...
  • Tipping PointsAaron FranklinBy Aaron FranklinTipping point one: Complete global deglaciation. This looks like it happened in the last Interglacial 120 000 yrs ago. The Arctic Sea ...
  • Arctic waters are heating upThe post Fires are raging again across Russia featured the image below, showing how much sea waters in the Arctic were already warming up on June 15, 2012.Satellite imag ...

0 komentar:

Posting Komentar